Yahoo Finance API – A Complete Guide with python
Yahoo Finance API – A Complete Guide
16 min read
Table of Contents
- What is the Yahoo Finance API?
- Why should I use the Yahoo Finance API?
- Why shouldn’t I use the Yahoo Finance API?
- Is the Yahoo Finance API free?
- Is the Yahoo Finance API usable with Python?
- What are some of the ways to access the Yahoo Finance API?
- How do I get started with the Yahoo_fin library?
- How do I download historical data using the Yahoo Finance API?
- How do I download fundamental data?
- How do I download trading data?
- How do I download data from the Income Statement?
- How do I download data from the balance sheet?
- How do I download data from the cashflow statement?
- How do I download options data?
- What are some of the alternatives to the Yahoo Finance API?
- Why did Yahoo Finance decommission their official API in 2017?
- Final thoughts
- Link to download code used
What is the Yahoo Finance API?
The Yahoo Finance API is a range of libraries/APIs/methods to obtain historical and real time data for a variety of financial markets and products, as shown on Yahoo Finance- https://finance.yahoo.com/.
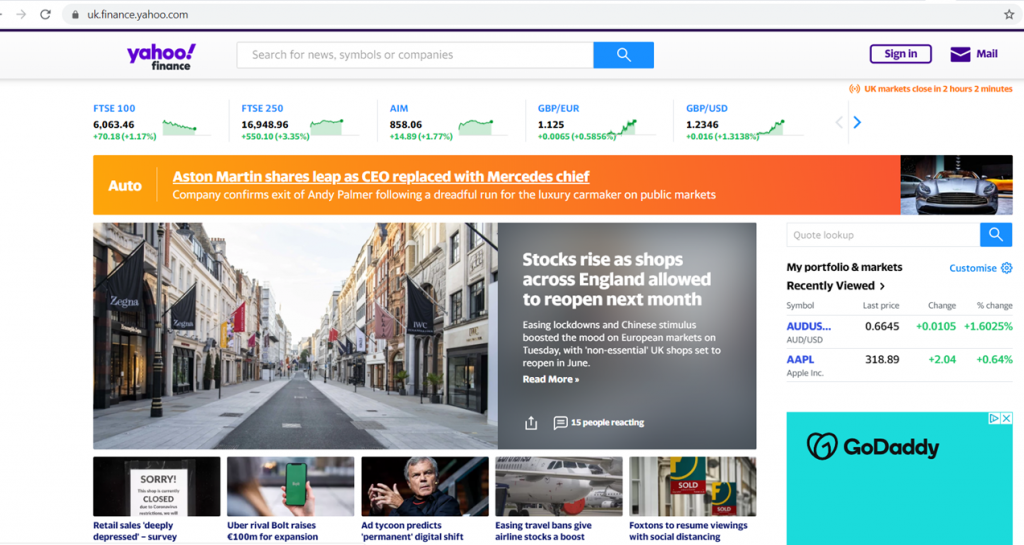
Some of the offerings include market data on Cryptocurrencies, regular currencies, stocks and bonds, fundamental and options data, and market analysis and news.
Yahoo used to have its own official API but this was shutdown in 2017- we will go over some possible reasons why briefly at the end of this article.
We will discuss the pros and cons of several of the unofficial APIs/libraries that now exist to access this data, and then go through how to use one of them in detail.
Why should I use the Yahoo Finance API?
- Free
- Impressive range of data
- Quick and easy to set yourself up
- Simple
One good reason is because it can be completely free. However, there are also third-party APIs with more support that do charge for their higher usage plans, but even they tend to have free tier options.
Impressive range of data. On-top of the core standard data, the Yahoo Finance API offers extras such as options and fundamentals data as well as market news and analysis, which alternatives such as IEX and Alpha Vantage don’t always have.
It’s also easy to set yourself up. Depending on the avenue you pick, setup ranges from a couple of lines of code to install libraries, to creating an account to access personal API keys and then just calling an API with a specific URL (depending on the data you want) and these keys.
It can be simple. Some of the libraries have documentation that fits on a single page whilst retaining functionality that is focused but sufficient for most normal use cases. While compact, it can still help you out by providing functions in the modules that do tedious legwork for you- like automatically getting data into pandas data frames where appropriate.
This makes the Yahoo Finance API perfect if you’re a relative beginner and just want to dive in and get your feet wet instead of spending hours puzzling over complex documentation.
» Here are some alternative (mostly) free data sources and guides:
Why shouldn’t I use the Yahoo Finance API?
- (Limitingly) simple
- Solutions built on-top are fragile
- Not officially for data requests
- Can get yourself rate limited/blacklisted
It’s simple. While we can get access to an impressive range of data, the Yahoo Finance API sometimes lacks the bells and whistles of more specialised APIs.
For instance Alpha Vantage offers fantastic ready made modules that calculate common technical analysis indicators for you- which could save an enormous amount of effort if you want to build a trading model that incorporates any of these!
It’s somewhat fragile. The Yahoo Finance API is no longer a fully official API, meaning that sometimes it does not provide all the information desired. As such, solutions attempting to gather data from Yahoo Finance use a mixture of direct API calls, HTML data scraping and pandas table scraping depending on the function and library/API in question.
The methods that HTML scrape gather their data by unofficially scraping the Yahoo Finance website, so their functionality is dependent on Yahoo not changing the layout/design of any of their pages.
As a quick aside, data scraping works by simply downloading the HTML code of a web page, and searching through all the HTML tags to find the specific elements of a page you want.
For instance below is the Yahoo Finance Amazon (‘AMZN’) Income Statement page:
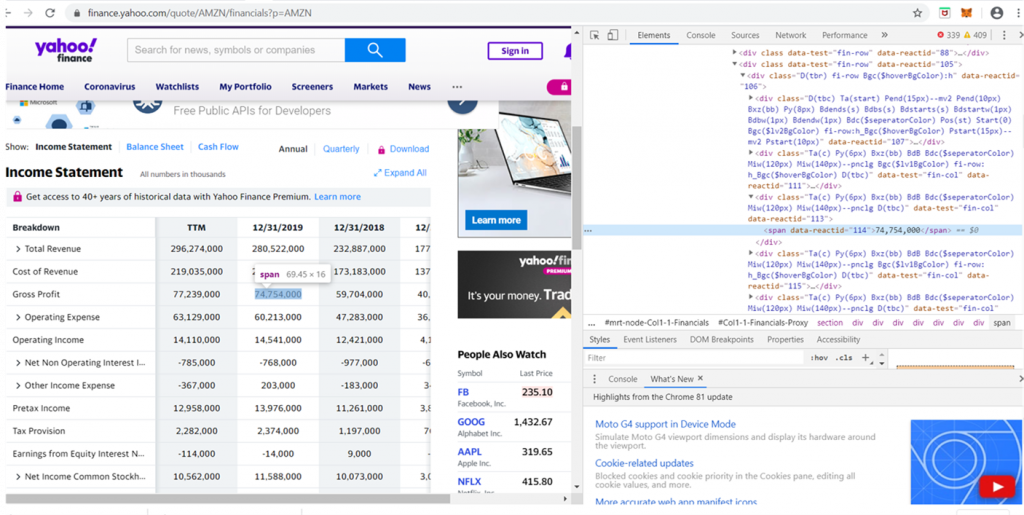
So if a method that data scrapes is supposed to be returning you elements of an income statement, it will be searching through the page structure through many div, class, and span tags etc. for various IDs to pick out the exact values that should be returned for each metric from Yahoo’s web pages.
For instance here the Gross Profit of 74,754 on 12/31/2019 has a data-reactid of “114”. If Yahoo Finance was ever to change the structure/attribute tag pointing to this value and the method designed to grab this specific piece of data uses data scraping, it might return something completely incorrect, or perhaps nothing at all.
Note that not all the methods for various APIs/libraries HTML scrape. In fact most don’t, with the majority of methods using pandas table scraping (much less fragile) or direct API calls, but just bear in mind there are some methods with these vulnerabilities, and some of the libraries/APIs are already known to have issues with certain functionalities.
Its not for official use. As an extension to the previous point, since some methods to access this data unofficially scrape the data, there is no guarantee their code will work in the future if Yahoo Finance changes some of it’s layout.
In particular the free open source libraries have a medium risk of some components not working at some point in the future, even if historically problems have eventually been fixed.
With the paid unofficial APIs, you would hope they have teams of developers that would rectify these issues ASAP, but that’s still no guarantee any strategies you build on-top of their data would not temporarily go haywire from dodgy (or non-existent) data – obviously an extreme risk to take if you have money in the game! That said we do know that RapidAPI does use its own internal API completely, so this is perhaps a good choice if you want to use the Yahoo Finance data more securely!
You can get yourself rate limited/blacklisted. Again because the libraries and unofficial APIs sometimes scrape data, they could get rate limited or blacklisted by Yahoo Finance at any time (for making too many scrapes).
In particular with the completely free unlimited usage libraries you have no idea where this line might be, and accidentally cross it.
Conclusion
As such on balance we think the Yahoo Finance API is excellent if you are a relative beginner and just want to get your feet wet/test out some ideas with some data quickly, or need to access something like options data.
However if you are planning to build a more complex and long term system that might be making hundreds to thousands of data requests per day or plan to make use of more specific information like technical analysis indicators in it’s modelling, we’d recommend going with another option that provides some of these extra functionalities built in.
Alternatively, you can pay a little extra dollar for one of the official finance data API alternatives like Quandl, Alpha Vantage or IEX where you can be sure your data won’t just be randomly cut-off one day.
Is the Yahoo Finance API free?
Yes, as we have already mentioned there are multiple ways to access Yahoo Finance data that are totally free.
If you want a bit more peace of mind that you are using a solution that is supported and kept up to date, there are maintained options you can pay for too.
Does the Yahoo Finance API work with Python?
Yes, almost every library/unofficial API available to access the Yahoo Finance data supports Python.
Some options support a range of other languages as well, just in case Python is not your thing.
What are some of the ways to access the Yahoo Finance API?
RapidAPI
RapidAPI is an API marketplace that supports Python, but also lets you pick from 15 different programming languages if you want something else.
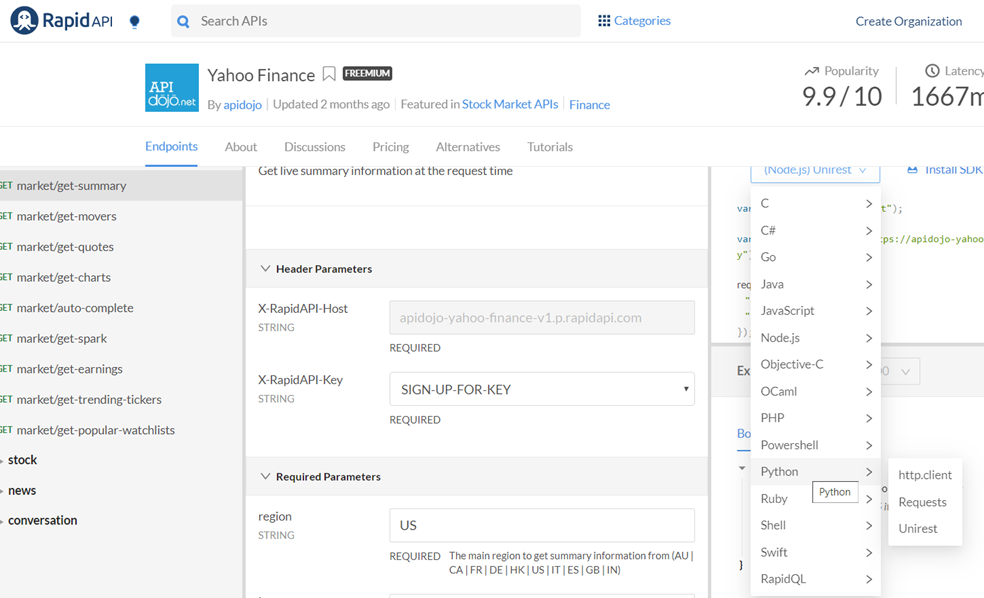
It offers a tiered pricing plan depending on your needs. There is a free option but for any serious operations the 500 requests/month might be a bit limiting:
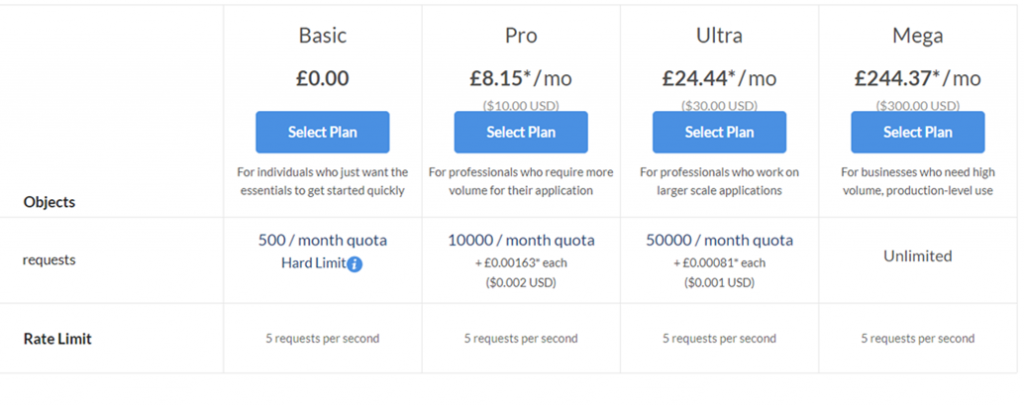
You will have to sign up for an account, and deal with API keys when making requests so RapidAPI is not quite as easy to get started with and utilise as some of the other options.
Also, results are almost always returned as (sometimes quite lengthy) JSONs, so you will often have to do quite a bit of preprocessing to get the data you want in the form you want- Yahoo_fin often helpfully puts the data in pandas dataframes automatically for you.
That said, the range of data available is the most extensive of the options we’ve found- with RapidAPI you can get fundamentals and options data as well as market news and analysis- the latter two are not available with our other options.
Also, if you head over to the main page, you’ll see that RapidAPI offers a huge range of APIs for different purposes, so familiarising how to use the site might have carryover benefit into using another API for a different project in the future.
Overall, RapidAPI is a bit fiddlier to use and get started with, but if you want to make a lot of requests or have access to more detailed data and don’t mind a bit of extra work, it could be a good bet.
yfinance
yfinance is a popular open source library developed by Ran Aroussi.
It’s completely free and super easy to setup- a single line to install the library:
$ pip install yfinance --upgrade --no-cache-dirAnd to use, where you just create a ticker object with a ticker symbol, and then simple method calls on the object return absolutely everything you could want to know.
For example:
import yfinance as yf
msft = yf.Ticker("MSFT")
print(msft.info)
Date
2003-02-19 0.08
2003-10-15 0.16
2004-08-23 0.08
2004-11-15 3.08
2005-02-15 0.08
...
2019-05-15 0.46
2019-08-14 0.46
2019-11-20 0.51
2020-02-19 0.51
2020-05-20 0.51
Name: Dividends, Length: 66, dtype: float64It offers less of a range of data than RapidAPI (no market news/analysis) but is much easier to use.
We won’t elaborate more here as we wrote an entire separate article on yfinance. To learn more: yfinance Library – A Complete Guide
Yahoo_fin
Yahoo_fin is another completely free open source library similar to yfinance, developed by the author of https://theautomatic.net/.
It is also very easy to setup and use, but again like yfinance lacks market analysis/news- though it offers a good range a good range of fundamentals and options data.
We will focus on it from now on in this article!
How do I get started with the Yahoo_fin library?
If you are completely new to Python, watch this video first to learn how to set up Python and your IDE (aka coding platform): Preparing Your Python Coding Environment
Installation
It’s also super easy. To install the Yahoo_fin library just run the command:
pip install yahoo_finIf you ever need to upgrade in the future just run:
pip install yahoo_fin --upgradeYahoo_fin also has a few dependencies:
- ftplib
- io
- pandas
- requests
- requests_html
Besides requests_html, these should all come pre-installed with Anaconda.
To install requests_html, it’s as easy as:
pip install requests_htmlNote requests_html requires Python 3.6+ to function. You don’t need it to use the majority of the functionality in Yahoo_fin, but there are a few functions you won’t be able to use without it. We’ll highlight which functions depend on it in a sec.
Other than that, that’s it! You’re ready to get started!
Library Layout
Just before we start looking at specific useful examples, let’s quickly go over the layout of the Yahoo_fin library.
Yahoo_fin has two modules- stock_info and options.
stock_info has the following methods:
get_analysts_info()
get_balance_sheet()
get_cash_flow()
get_data()
get_day_gainers()
get_day_losers()
get_day_most_active()
get_holders()
get_income_statement()
get_live_price()
get_quote_table()
get_top_crypto()
get_stats()
get_stats_valuation()
tickers_dow()
tickers_nasdaq()
tickers_other()
tickers_sp500()
And options has:
get_calls()
get_expiration_dates()
get_options_chain()
get_puts()
And there are the methods you can’t use without requests_html are:
#stock_info module
get_day_gainers()
get_day_most_active()
get_day_losers()
get_top_crypto()
#options module
get_expiration_dates()
Right, let’s start playing around a bit with the library!
How do I download historical data using the Yahoo Finance API?
Historical price data is the one thing we will probably almost always need.
The method to get this in the Yahoo_fin library is get_data().
We will have to import it from the stock_info module, so we do:
from yahoo_fin.stock_info import get_dataIt takes the arguments:
- ticker: case insensitive ticker of the desired stock/bond
- start_date: date you want the data to start from (mm/dd/yyyy)
- end_date: date you want the data to end (mm/dd/yyyy)
- index_as_date: {True, False}. Default is true. If true then the dates of the records are set as the index, else they are returned as a separate column.
- interval: {“1d”, “1wk”, “1mo”}. Refers to the interval to sample the data: “1d”= daily, “1wk”= weekly, “1mo”=monthly.
get_data(ticker, start_date = None, end_date = None, index_as_date = True, interval = “1d”)Demo with one ticker
So for example with a single ticker:
amazon_weekly= get_data("amzn", start_date="12/04/2009", end_date="12/04/2019", index_as_date = True, interval="1wk")
amazon_weekly
Gets all of the historic data available for Amazon with a weekly interval between the two dates:

Note that:
- The start/end dates don’t match exactly- the returned data snaps to some date within a week’s distance as per the exact data Yahoo Finance holds by the time-frame.
- The data is returned in a pandas dataframe.
- The date of the records is the index of the dataframe.
This is fantastically useful as normally we would have to convert our data from JSON, load it into a pandas dataframe and set the index as the dates, all with separate lines of code.
Yahoo_fin has done all the legwork and has our data ready for modelling in a single line of code!
Demo with multiple tickers
If we want to collect historical data for many tickers at once, we will want to create a list of the tickers, an empty dictionary, and iterate through the list appending each pandas dataframe to the empty dictionary:
ticker_list = ["amzn", "aapl", "ba"]
historical_datas = {}
for ticker in ticker_list:
    historical_datas[ticker] = get_data(ticker)
Now if we want to look at the historical data for a particular ticker, we just lookup that ticker in the dictionary and we will conveniently have our data in a pandas dataframe as before:
historical_datas["aapl"]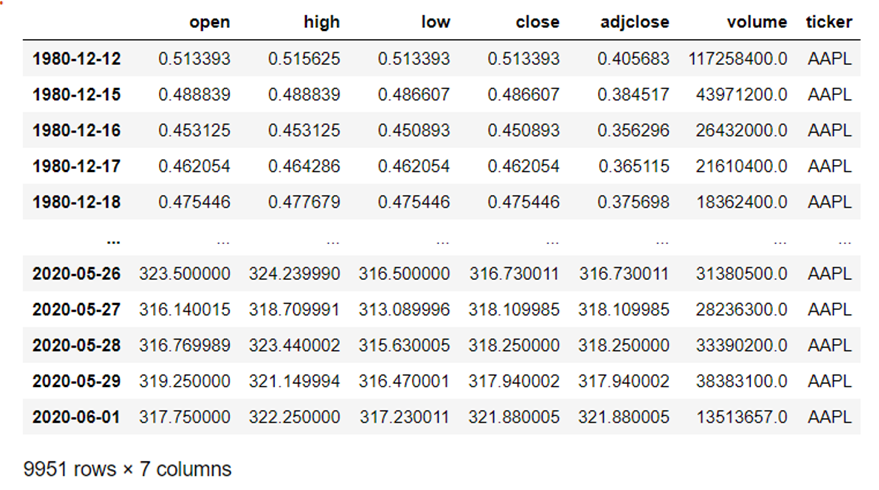
This setup is particularly useful in combination with some of Yahoo_fin’s other methods if we want to quickly gather data for all the certain markets.
For instance tickers_dow() returns a list of all the tickers in the Dow Jones so we can do:
import yahoo_fin.stock_info as si
dow_list = si.tickers_dow()
Here we are just importing the whole stock_info module as si, so we can easily call all the methods without a new import each time.
print("Tickers in Dow Jones:", len(dow_list))
dow_list[0:10]
Tickers in Dow Jones: 30
['AAPL', 'AXP', 'BA', 'CAT', 'CSCO', 'CVX', 'DIS', 'DOW', 'GS', 'HD']Iterate through the list of tickers, appending each time to the dictionary again:
dow_historical = {}
for ticker in dow_list:
    dow_historical[ticker] = si.get_data(ticker, start_date="01/01/2020", end_date="01/03/2020", interval="1d")
dow_historical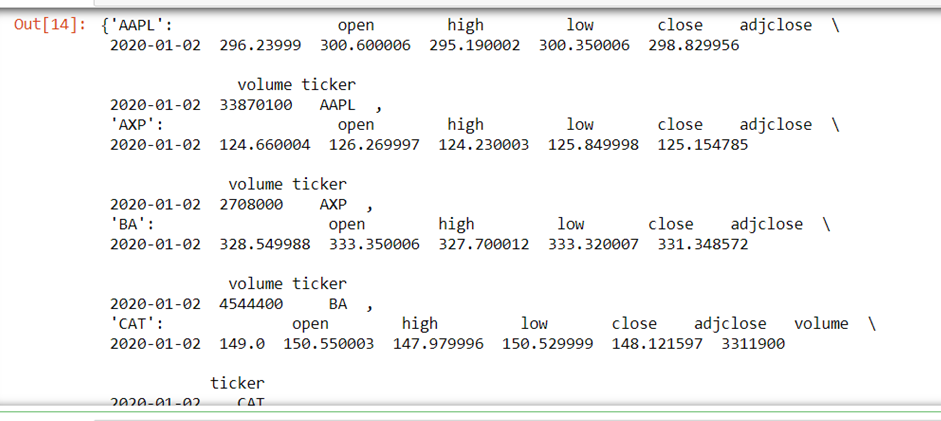
And that’s it, now you have a dictionary of pandas dataframes of historical data for all the stocks in the Dow Jones!
You can also use the exact same method to quickly acquire all the data for a few other markets with Yahoo_fin’s inbuilt methods:
- Nasdaq: tickers_nasdaq()
- S&P500: tickers_sp500()
- Others: tickers_other()
» What do you do with the data you got from Yahoo Finance? Backtest your trading ideas with them! Link: Backtrader for Backtesting (Python) – A Complete Guide
How do I download fundamental data?
With Yahoo_fin there are often a few ways to get the same bit of data with different methods calls.
Let’s try grabbing a few different bits of fundamentals data.
Price to Earnings Ratio
The easiest way to get the Price to Earnings (P/E) ratio for a stock is with the get_quote_table() function.
Note many of the methods that follow automatically return the data in a pandas dataframe.
get_quote_table() doesn’t do this by default but takes an optional dict_result parameter that when set to False also makes the method return a pandas data-frame (instead of a dictionary).
It returns a really useful summary of some fundamental data:
quote_table = si.get_quote_table("aapl", dict_result=False)
quote_table
{'1y Target Est': 314.55,
'52 Week Range': '174.52 - 327.85',
'Ask': '323.97 x 1300',
'Avg. Volume': 48563118.0,
'Beta (5Y Monthly)': 1.17,
'Bid': '322.30 x 1000',
"Day's Range": '317.23 - 322.35',
'EPS (TTM)': 12.73,
'Earnings Date': 'Jul 28, 2020 - Aug 03, 2020',
'Ex-Dividend Date': 'May 08, 2020',
'Forward Dividend & Yield': '3.28 (1.02%)',
'Market Cap': '1.395T',
'Open': 317.75,
'PE Ratio (TTM)': 25.29,
'Previous Close': 317.94,
'Quote Price': 321.8500061035156,
'Volume': 20185053.0}
So to get the P/E ratio we can simply do:
quote_table["PE Ratio (TTM)"]25.29We can also get the P/E ratio with the get_stats() or get_stats_valuation() functions.
get_stats_valuation() actually returns the first 9 fields in get_stats(), so get_stats() is just a lot more expansive.
This is what get_stats_valuation() looks like:
si.get_stats_valuation("aapl")
Dividends
To get the dividends expected from holding a stock we can go back to the get_quote_table() function and do:
quote_table = si.get_quote_table("aapl")
quote_table["Forward Dividend & Yield"]
'3.28 (1.02%)'Fundamentals data with multiple tickers at once
Lets have a go at grabbing fundamentals data for a list of tickers at once, and then have a go at picking out a single attribute we want to rank all stocks by.
Lets import the pandas module as we will need it and generate a list of the dow_tickers again.
import pandas as pd
# get list of Dow tickers
dow_list = si.tickers_dow()
This next bit of code is very much like the looping code we used before where we made a dictionary of pandas dataframes- one for each ticker, however here we are just renaming our columns to “Attribute” and “Recent”:
dow_stats = {}
for ticker in dow_list:
    temp = si.get_stats_valuation(ticker)
    temp = temp.iloc[:,:2]
    temp.columns = ["Attribute", "Recent"]
    dow_stats[ticker] = temp
dow_stats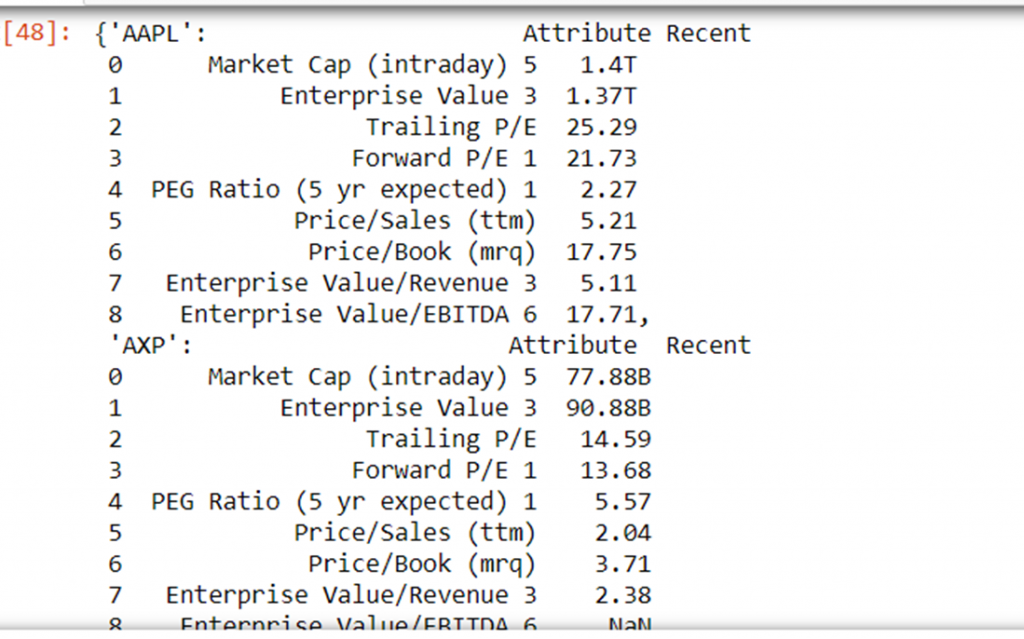
Now we combine all of these dataframes into a single dataframe:
combined_stats = pd.concat(dow_stats)
combined_stats = combined_stats.reset_index()
combined_stats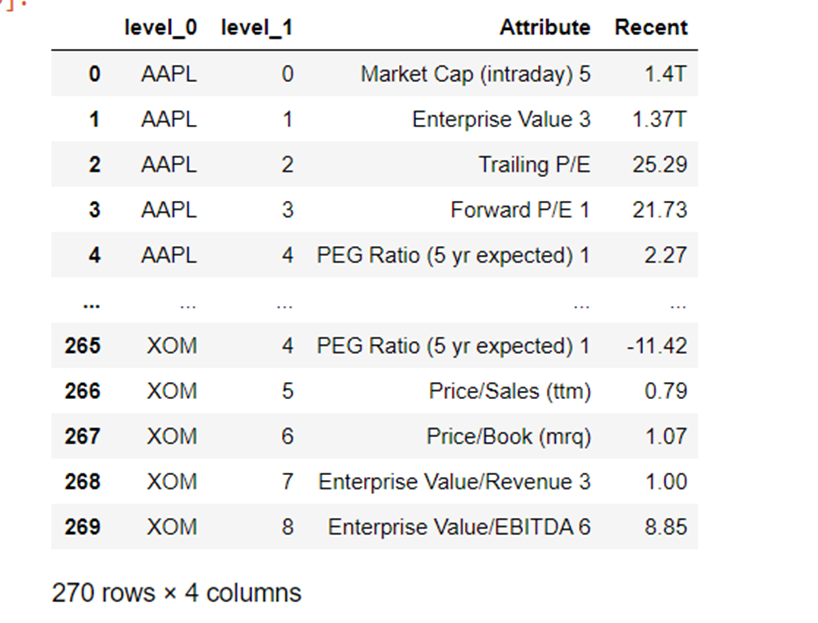
And delete the unnecessary “level_1” column and clean up the renaming column names:
del combined_stats["level_1"]
# update column names
combined_stats.columns = ["Ticker", "Attribute", "Recent"]
combined_stats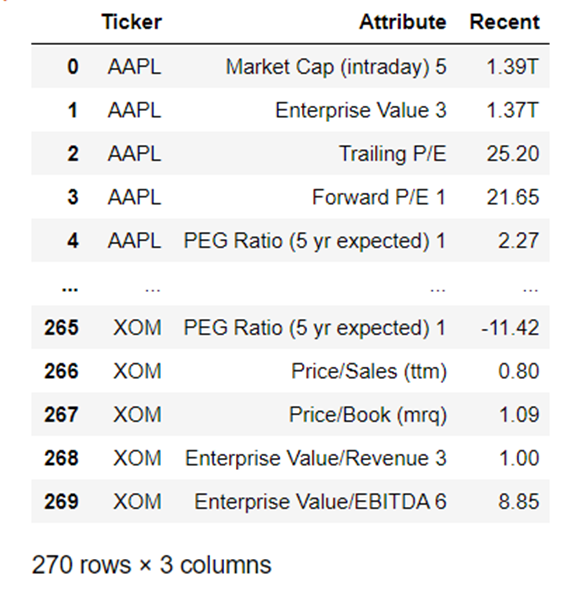
Great, so now we have some fundamental data in the same dataframe for many stocks at once!
Comparing by a particular attribute
We can go one step further and pick out an attribute we would like to compare between all stocks, for instance again P/E ratio:
pe_ratios = combined_stats[combined_stats["Attribute"]=="Trailing P/E"].reset_index()
pe_ratios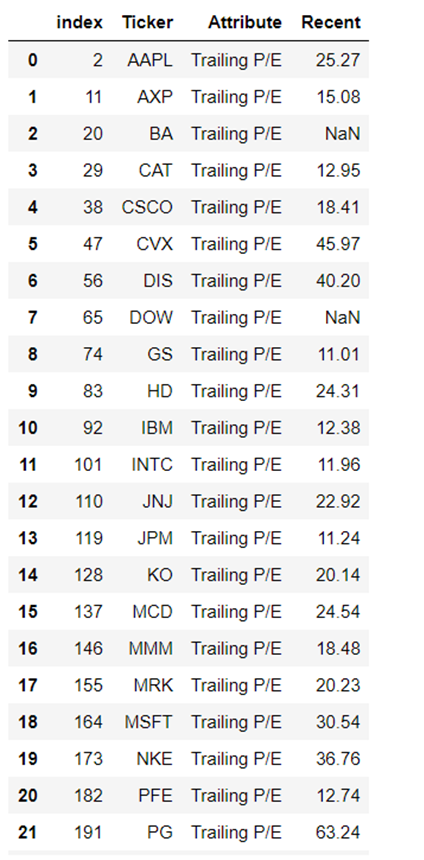
And we can order the ‘Recent’ column to find the best/worst earners:
pe_ratios_sorted = pe_ratios.sort_values('Recent',ascending=False)
pe_ratios_sorted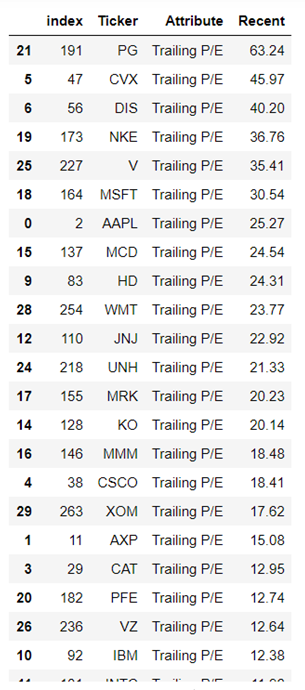
How awesome- we now easily analyse a particular attribute for every stock in a market! Let’s quickly buy us some PG!
Also it’s worth noting we can use the previous blocks of code to quickly put together a giant dataframe of all attributes for different tickers for most of the methods we will cover going forward.
Now let’s quickly blast through a bit more of the functionality available to us!
How do I download trading data?
Remember, you can get the historical open, high, low, close, volume data sampled at regular intervals from the get_data() method:
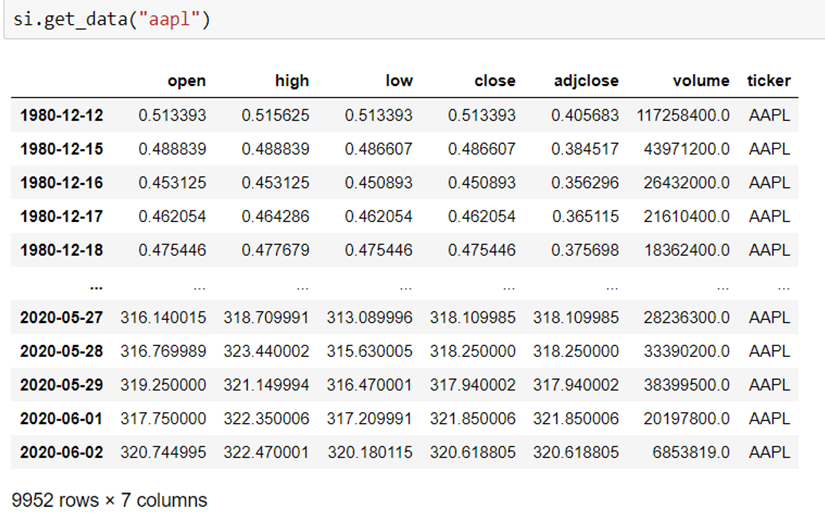
Other than that you can find the data nicely collected for the market cap, volume and current day highs and lows in the get_quote_table() method:
si.get_quote_table("aapl"){'1y Target Est': 314.55,
'52 Week Range': '174.52 - 327.85',
'Ask': '321.54 x 1300',
'Avg. Volume': 49012080.0,
'Beta (5Y Monthly)': 1.17,
'Bid': '321.48 x 1000',
"Day's Range": '320.38 - 322.47',
'EPS (TTM)': 12.73,
'Earnings Date': 'Jul 28, 2020 - Aug 03, 2020',
'Ex-Dividend Date': 'May 08, 2020',
'Forward Dividend & Yield': '3.28 (1.02%)',
'Market Cap': '1.389T',
'Open': 320.74,
'PE Ratio (TTM)': 25.18,
'Previous Close': 321.85,
'Quote Price': 320.4599914550781,
'Volume': 6657073.0}
Market Cap
So to get the market cap we could do:
si.get_quote_table("aapl")["Market Cap"]'1.39T'Volume
We can get either the 52-week average volume or current with volume with:
si.get_quote_table("aapl")["Avg. Volume"]
si.get_quote_table("aapl")["Volume"]
49012080.0
7274811.0Highs and Lows
And we can get the daily high and low with:
si.get_quote_table("aapl")["Day's Range"]'319.32 - 322.47'If we want to actually do something with the highs and lows we can split this string apart with Python’s split() method and convert the type to float:
daily_range = si.get_quote_table("aapl")["Day's Range"]
daily_low = float(daily_range.split(" - ")[0])
daily_high = float(daily_range.split(" - ")[1])
print("daily low:", daily_low)
print("daily high:", daily_high)
daily low: 319.32
daily high: 322.47You can also find variations of these data from the get_stats() method.
How do I download data from the Income Statement?
Yahoo_fin has a fantastically useful get_income_statement() function that does this all in one for us:
income_statement = si.get_income_statement("aapl")
income_statement
Remember you can always transpose the indices and columns if you want to perform analysis on the data-frame by time period in a more normal manner:
transposed = income_statement.transpose()
transposed
“ttm” stands for Trailing Twelve Months and typically shows either the most recent twelve months of a company’s operations or the last twelve months before a major event- like an acquisition.
How do I download data from the balance sheet?
Again, super easy with the get_balance_sheet() function:
balance_sheet = si.get_balance_sheet("aapl")
balance_sheet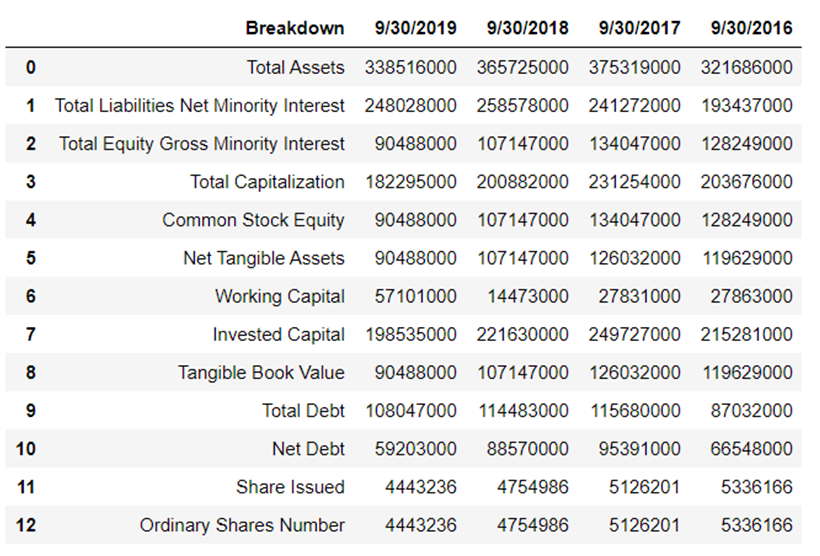
How do I download data from the cashflow statement?
Using the get_cash_flow() function if you hadn’t spotted the pattern yet!
cash_flow_statement = si.get_cash_flow("aapl")
cash_flow_statement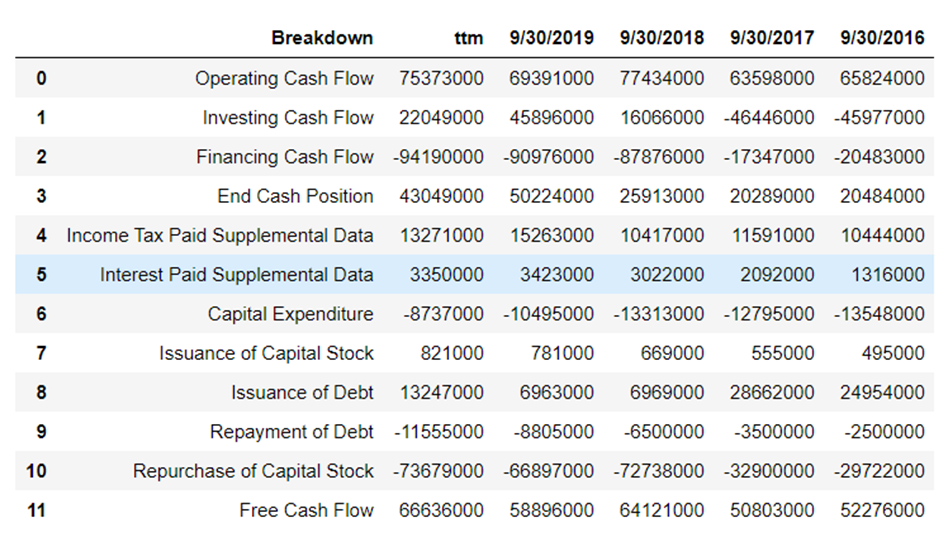
How do I download options data?
So far we’ve only been using the stock_info module, now finally we will have a little play with the options module.
Lets import the options module with a reference first:
import yahoo_fin.options as opsBriefly, options are contracts giving a trader the right, but not the obligation, to buy (call) or sell (put) the underlying asset they represent at a specific price on or before a certain date.
How do I get Expiration dates?
Use the get_expiration_dates() method:
expiration_dates = ops.get_expiration_dates("aapl")
expiration_dates
['June 5, 2020',
'June 12, 2020',
'June 19, 2020',
'June 26, 2020',
'July 2, 2020',
'July 10, 2020',
'July 17, 2020',
'September 18, 2020',
'October 16, 2020',
'November 20, 2020',
'December 18, 2020',
'January 15, 2021',
'June 18, 2021',
'September 17, 2021',
'January 21, 2022',
'June 17, 2022',
'September 16, 2022']Note that the following functions all take an optional Expiration Date parameter, but it should be given in the form ‘mm/dd/yyyy’, so you will have to do a bit of conversion if you want to use a specific date.
In the absence of a date being passed (ticker only), the functions will return the earliest upcoming expiration date’s data.
How do I get Calls Data?
You use the get_calls() method:
ops.get_calls("aapl")
How do I get Puts Data?
Similarly, you use get_puts():
ops.get_puts("aapl", "09/16/2022") 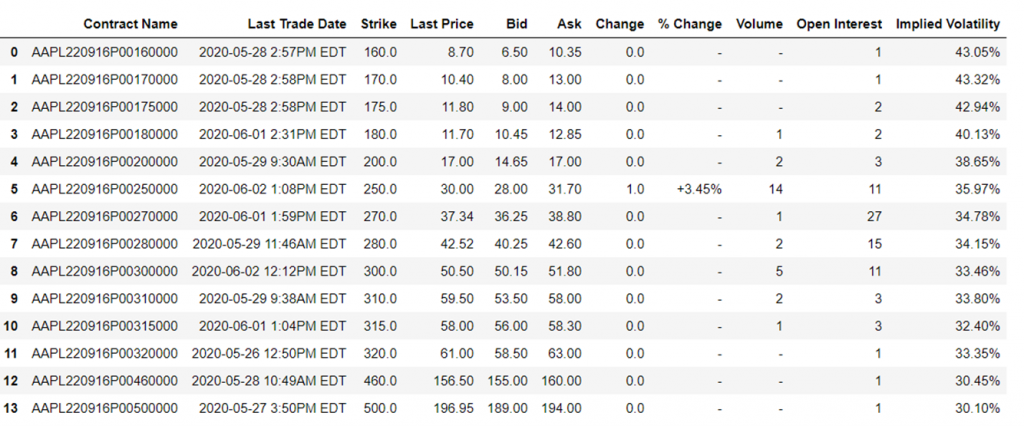
Finally if you want both the calls and puts data together, use the get_options_chain() method.
It returns a dictionary with two keys- “calls” and “puts”, each with their respective tables as data-frames as the values.
What are some of the alternatives to the Yahoo Finance API?
If you aren’t bothered about using data specifically from Yahoo Finance, then the following alternative APIs are worth considering:
Alpha Vantage
As we’ve already mentioned, a really big plus is that in addition to price data, Alpha Vantage provides more than 50 common technical indicators- perfect if you’re looking to build a model that uses some of these.
Their free tier is also very generous- a useful 500 requests per day (with a 5 requests per minute limit)- much better than RapidAPI’s 500 per month!
We have a guide specifically on Alpha Vantage on this website, check out https://algotrading101.com/learn/alpha-vantage-guide/ if you want to learn more!
Polygon
If you want blazing speed and high performance, Polgon.io might just be the way to go.
They connect to data directly from various exchanges, and their Enterprise plan claims a ridiculous < 1 millisecond delay.
This all comes with a hefty price tag though, with their cheapest option being $49/month (besides a 7-day free trial).
Definitely worth considering if you are building a very serious system.

IEX
IEX offers an absolutely enormous range of data- check out the left hand summary bar of: https://iexcloud.io/docs/api/
The documentation is very extensive, making it hard to dive into quickly.
It also has complicated rate limits where different data is weighted differently when it comes to working out your usage. So you will need to run some calculations to make sure you stay within your desired limits, but my gosh can you find data for almost anything there!
We have a guide for it on this site as well, check out: https://algotrading101.com/learn/iex-api/
Why did Yahoo Finance decommission their official API in 2017?
Yahoo decommissioned their official API on May 15th 2017.
An official reason was never given but it is widely thought to be an issue with large scale misuse of data because so many people were using it to build personal applications (there was no requirement to be logged into Yahoo or anything!).
This is the error message that suddenly appeared when people attempted to call the API to download:

Downloading the data was against its intended use (to view only) and in violation of the terms and conditions of the parties the data was gathered from (exchanges and financial institutions don’t like giving away their data for free!).
These days, we have a range of unofficial alternatives, some of which we have of course covered in this article.
Final thoughts
The Yahoo Finance API offers a decent range of data and can be accessed totally freely.
Some of the libraries developed to access it unofficially are fantastically easy to use, so it’s perfect to experiment with if you’re a beginner.
Some solutions built on-top do however rely on unofficial scraping to gather the data. There is also the risk of Yahoo Finance changing it’s API URL or methods, considering it is unofficial after all.
Thus, we absolutely don’t recommend it to build mission critical systems where you have a lot of money on the line!
Use an official alternative that is connected directly to exchange data instead, like IEX or Polygon.
Link to download code used
You can find the code used in this article here.
Referencess - https://algotrading101.com/
Credits - https://algotrading101.com/


Comments
Post a Comment